The Cooperative Election Study (CES) for 2024 is now available. And their election data shows some foreboding signs about how American Christians are being split along party lines.
There have already been some interesting headlines drawing from the 2024 dataset. Two days ago, Tessa Gervasini writing for the National Catholic Register reported that the growth of the so-called “nones” (those who do not identify with any particular religion) has now stopped.
The fact that this halt of the growth of the nones coincides with the stabilization of American Christianity’s years-long decline during Biden’s presidency is interesting, and merits an article for another time. But for now, what does the CES election data say about Christianity and the 2024 presidential election?
The CES Election Data: White Evangelicals
Just like Gervasini, this story owes its existence to the work of Ryan Burge, research director of Faith Counts. Yesterday, Burge created a graph drawing from the CES election data. And it reveals much about how Christians voted this past election cycle.
This is the first post-election data that I am aware of showing the religious demographics of how Americans voted. Burge breaks down the significant findings in his post on X.
Here’s the story of religion and politics in the 2024 election.
Donald Trump did even better with white evangelicals – up to 83% now.
He also gained ground with non-white Christian groups, especially Catholics and evangelicals.
Harris’ base – Black Protestants + atheists. pic.twitter.com/C5lKz08TLF
— Ryan Burge � (@ryanburge) April 5, 2025
As he says, the white evangelical vote increased from prior elections. In March 2021, Burge wrote for the Religion in Public blog, sharing insights from the CES election data of prior cycles. Below is the white evangelical vote; let us focus on the bars for 2016 and 2020.

As we can see, Trump received 78% of the white evangelical vote in 2016, and 81% in 2020. And the latest data shows that in 2024, 83% of white evangelicals voted for Trump. That’s a consistent growth across each cycle.
The CES Election Data: White Catholics
We find the same trend among white Catholics. In that same blog post for Religion in Public, Burge breaks down the data for white Catholics as well.

As we can see, the CES election data shows that Trump received 56% of the white Catholic vote in 2016. This grew by three points, to 59% in 2020. And when we recall the data for white Catholics in 2020, the figure rises to 63%, an increase of four points.
But do we see the same trend of growth among Christians of color?
The CES Election Data: Christians of Color
Now we look at what the CES election data reveals about Christians of color. We will begin by examining non-white evangelicals.

In 2016, 36% of evangelicals of color voted for Trump. This rose by four points to 40% in 2020. In 2024, the CES election data shows an increase by a boggling eight points to 48%.
What about non-white Catholics?

As we see, the growth is slightly more drastic. Beginning in 2016, 26% of Catholics of color cast their vote for Trump. This grew five points in 2020, with 31% of non-white Catholics doing so. Then, this past election, Trump grew by nine points, to 40%.
The only exception to this trend is Black Protestants. Let’s take a look at the data.

In Trump’s first presidential run, 6% of Black Protestants voted for him. In 2020, this grew by five points to 11%. However, in 2024, this percentage stagnated, remaining at 11% of Black Protestants.
The CES Election Data: Mainline Protestants
There has been some buzz about political realignments among Mainline Protestants. Despite the Mainline’s reputation for theological liberalism and thus political liberalism (the two are not the same, but often coincide), Trump consistently received a slight majority of the Mainline vote.

In both 2016 and 2020, the CES election data showed that 52%, or just over half of Mainline Protestants cast their votes for Trump. In 2024, this figure rose by three points to 55%.
It would be interesting to see how these trends change based on race, but it does not seem like the CES breaks down Mainline Protestants into racial demographics.
Growth from all Groups
I plugged these numbers into a spreadsheet of my own, and saw some interesting trends.
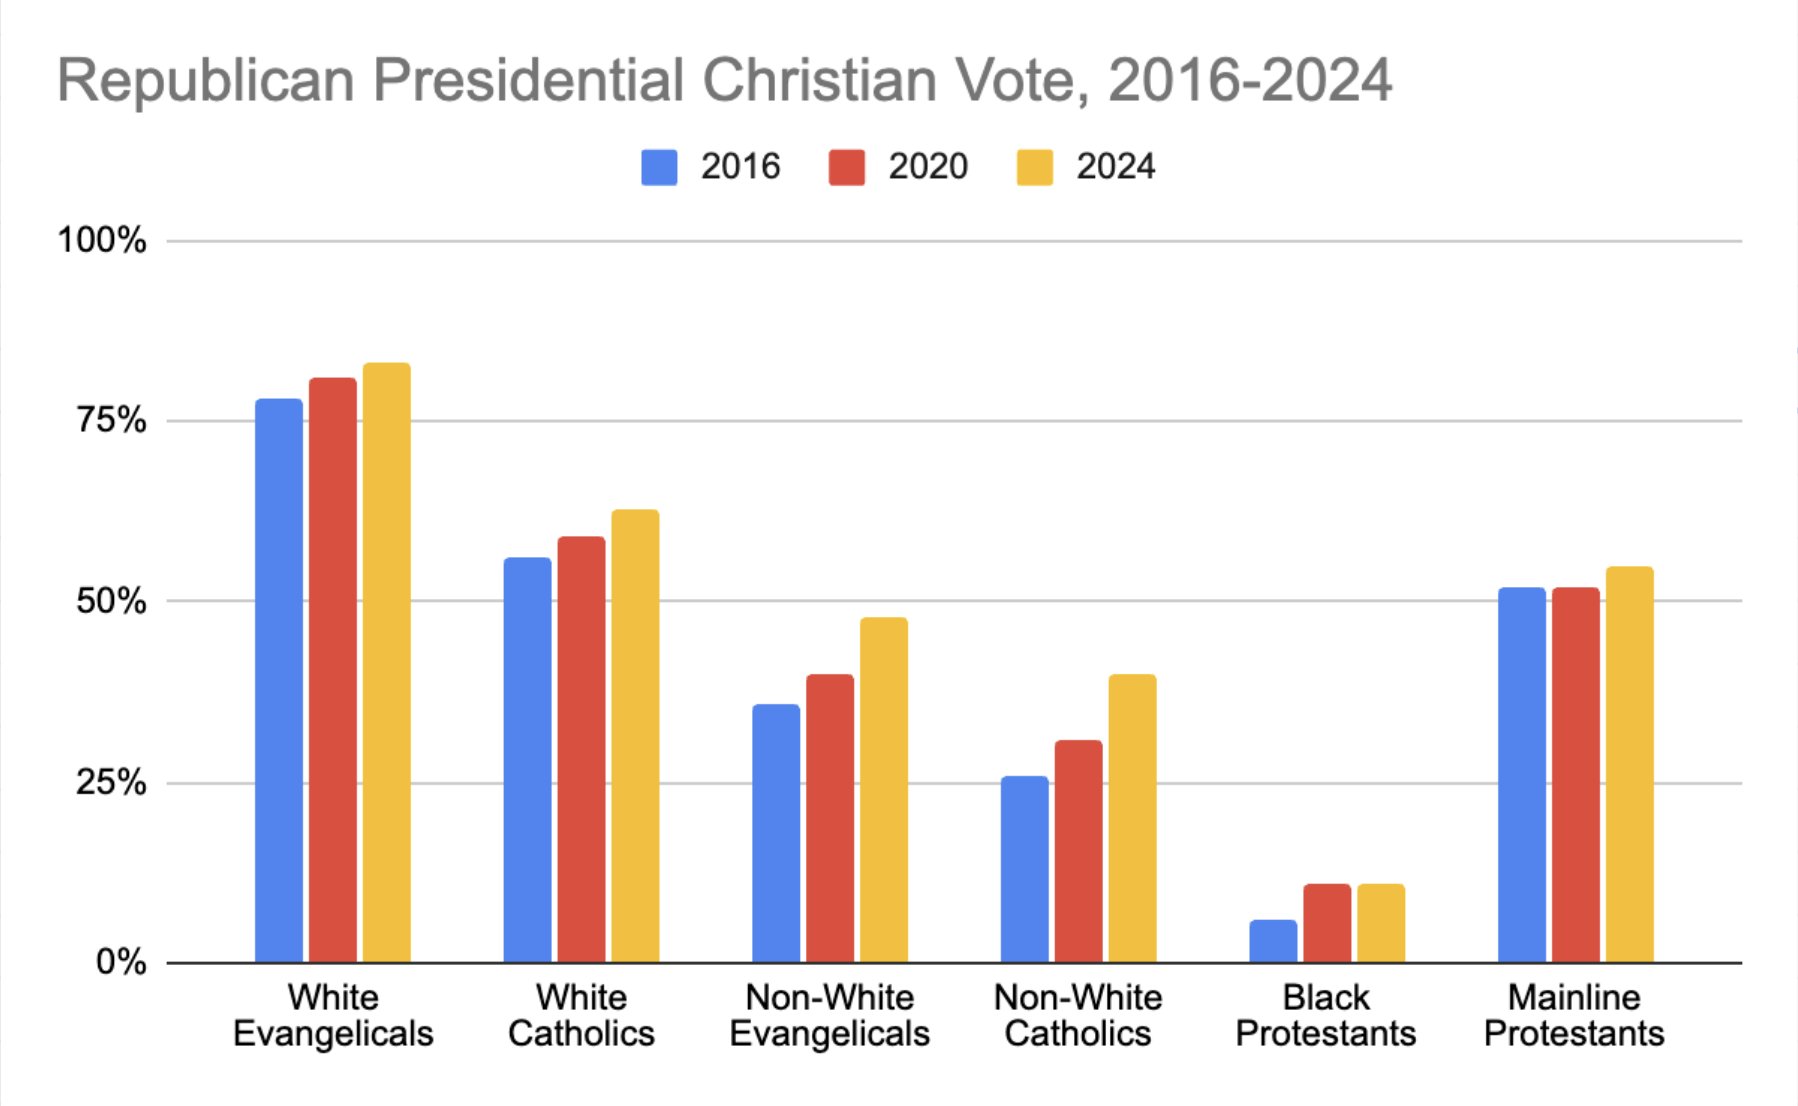
We see from the CES election data that Christian support for Trump has increased from all demographics. Yet, there are variations. Among all evangelicals and Catholics, Trump enjoys a consistent increase. But the magnitude of increase is more pronounced among evangelicals and Catholics of color.
While Trump saw an increase of support in 2020 from Black Protestants, this growth did not continue in 2024. And a similar pattern can be seen among Mainline Protestants, who stayed stagnant from 2016 to 2020 but increased slightly in 2024.
Significance of the CES Election Data
In my last article on why Gen Z women are leaving religion at unprecedentedly high rates, I hypothesize that this demographic change is due to social sorting. According to political scientist Lilliana Mason, groups that are politically diverse enjoy cross-cutting identities. A diverse group has more things to tolerate and learn about within itself. As a result, a diverse group will be able to relate in healthy ways with other groups.
However, in a recent piece by the sociologist Michael Emerson, Emerson found that certain Christian groups are becoming less politically diverse. In prior times, Christian groups could be distinguished politically based on their denominational status. For example, evangelicals and Mainline political views correlated with being evangelical or Mainline. Now, however, these differences are becoming less pronounced along denominational lines and more along whether Christians are “practicing.”
Emerson’s criteria for a “practicing Christian” is a person who identifies as Christian, reports their faith as being very important to them, and attends church at least once a month. Practicing Christians in certain groups are becoming more politically conservative. Which groups are these?
According to Emerson, white Christians (be they evangelical, Mainline, or Catholic) and Asian American Christians. There is no data yet to show whether this is occurring amongst Latino believers. But Black Christians are the one exception to this trend, who vote Democrat regardless of whether they meet Emerson’s definition of a “practicing Christian.”
Combining Emerson’s findings with Mason’s social sorting theory, which holds that groups become less diverse because those who are different sort out or leave, I hypothesize that these Christian groups are homogenizing because political dissidents are leaving.
What Mason, Emerson, and the CES election data may suggest is that Trump may not be gaining support solely because more Christians are voting for him. Rather, Trump may be gaining support because certain Christian groups are becoming more politically homogenous. Homogenization increases because political outsiders are sorting out. They are leaving because their political differences are rendering them politically and spiritually homeless.
In my last article, I argue that this is happening amongst Gen Z women. This demographic tends to be much more pro-feminist than older generations, and more career-focused than their male counterparts. Just to take Gen Z women as an example, if Gen Z evangelical women are leaving evangelical churches, it is no surprise that the percentage of evangelicals who vote for Trump is increasing. So too with other Christian groups.
Now, sorting alone cannot account for such rises in the pro-Trump Christian vote. In fact, if the sorting hypothesis is true, it probably plays only a meager role in the increase of Trump’s Christian vote, percentage-wise. But the overlap in the CES with Emerson’s findings, coupled with Mason’s theoretical framework adds more possible evidence that certain strands of American Christianity are losing people because of politics. If true, this holds serious implications for how these homogenized groups will interact with outgroups in the future.